12 Key Metrics for Auto Repair Shop Performance in 2026

Running an auto repair shop means tracking many moving parts, and the difference between a profitable operation and a struggling one often comes down to which numbers you pay attention to. Technician productivity, bay utilization, comeback rates, and labor efficiency all tell a story, but only if someone is actually reading them. Solid automotive shop workflow management depends on real data, not instinct, to catch problems early and protect margins before they erode.
Most shop owners already know their numbers matter; the challenge is having them organized and accessible enough to act on. Scattered data across different tools makes it hard to spot trends or respond quickly to what's happening on the floor. Support Lane brings those metrics together in one clear view with their shop management software, so owners and managers can focus on running a better shop instead of chasing down figures.
Table of Contents
What Is Auto Repair Shop Performance, and Why Should You Measure It?
How Can You Tell When Your Auto Repair Shop Is Underperforming?
How Often Should You Review Your Auto Repair Shop Performance Metrics?
12 Key Metrics for Auto Repair Shop Performance in 2026
How to Improve Auto Repair Shop Performance Using KPI Data
How Support Lane Helps You Track and Improve Auto Repair Shop Performance
Sign up for Your Free Trial to Manage Your Auto Shop with Ease Today
Summary
Tracking the right performance metrics is what separates a busy shop from a profitable one. The 2026 Ratchet+Wrench Industry Survey of more than 430 independent shop owners and managers found that shops tracking key performance indicators were three times more likely to exceed $1 million in annual revenue than those that did not. The gap comes down to decision quality, not effort or location.
Underperformance in auto repair shops rarely looks like failure. It looks like a full schedule and a steady stream of cars. But the same survey found that roughly one in eight shops generates little to no net profit, meaning many operations work a full calendar without capturing meaningful returns after expenses.
Low closing rates on recommended work represent one of the most overlooked revenue gaps in shop operations. Most shops convert 50-59 percent of recommended work, while only 9 percent report closing ratios above 90 percent. The inspection already happened, the technician already identified the problem, and the vehicle is already on the lift, making every declined recommendation revenue the shop earned the right to capture but walked away from.
Technician efficiency is where lost revenue hides most quietly because hours are still spent regardless of billable output. Many shops report technician efficiency below 80 percent, meaning for every ten hours worked, fewer than eight generate billable revenue. Across a team of four technicians over fifty weeks, that gap adds up to a number that would surprise most shop owners.
Weekly metric reviews consistently outperform monthly ones because operational problems compound fast. A technician losing one billable hour per day to parts delays or slow approvals loses roughly 20 hours by month-end, and that loss shows up as reduced gross profit with no clear cause. Comeback rate is the clearest example of a metric that can look acceptable monthly while signaling a serious problem at the weekly level, with a healthy target sitting below 2 percent.
Independent auto repair shops operate on thin profit margins of roughly 6 to 12 percent, so a few percentage points of improvement in labor efficiency or parts gross profit can mean the difference between a profitable quarter and a flat one. Support Lane's shop management software addresses this by connecting job notes, estimates, customer messages, and invoices to a single record, so performance data surfaces in real time rather than requiring manual assembly after the moment to act has already passed.
What Is Auto Repair Shop Performance, and Why Should You Measure It?
A busy shop is not the same as a profitable one. Performance measurement separates the two. Tracking the right numbers lets you catch problems before they cost money, rather than reacting after the fact.
"A shop can be full of cars every single day and still lose ground — the difference is whether you're measuring what actually drives profit." — SupportLane, Shop Operations Insight
Key Point: Busyness is not profitability. Without tracking the right metrics, a high-volume shop can bleed money on every repair order.
Shop performance covers the indicators that show whether your daily effort turns into real profit. Average repair order value, labor efficiency, parts gross profit, technician productivity, and customer return rate separate a growing shop from one that stays flat despite working just as hard.
Performance Indicator
Average Repair Order Value
What It Tells You
Whether each ticket is capturing full revenue potential
Performance Indicator
Labor Efficiency
What It Tells You
How productively your technicians use billable hours
Performance Indicator
Parts Gross Profit
What It Tells You
Whether your parts pricing covers cost and drives margin
Performance Indicator
Technician Productivity
What It Tells You
Individual output vs. available capacity
Performance Indicator
Customer Return Rate
What It Tells You
Whether your service earns long-term loyalty
Tip: Start by tracking just one of these indicators this week — even a single metric tracked consistently will reveal patterns you can act on.
Warning: Shops that skip performance tracking often discover problems too late — after margins have already eroded and technician capacity has been wasted.
What shop performance numbers actually show you
The failure point is usually not effort but visibility. A technician can work a full day while two hours go unbilled because no one caught the gap. An advisor can write twenty tickets in a week while half miss recommended services because inspections aren't being tracked. These are information problems that only show up when you measure consistently.
Why do key metrics for auto repair shop performance close the visibility gap?
Most shop owners track performance from memory, check bank statements monthly, or build spreadsheets across different tools. This creates a delay: by the time you notice a drop in gross profit margin or rising cycle time, the pattern has already been underway for weeks. Shop management software like Support Lane connects bookings, jobs, and invoices into a single record so performance data appears in real time.
What does market growth say about shops consolidating their numbers?
According to Data Horizzon Research's Auto Repair Shop Software Market Report, the auto repair shop software market was worth USD 1.8 billion in 2024 and is expected to reach USD 4.2 billion by 2033, growing at 8.8 percent annually. This growth reflects owners consolidating operations into unified systems and uncovering previously hidden data.
Why consistent measurement changes your revenue trajectory
The 2026 Ratchet+Wrench Industry Survey of more than 430 independent shop owners and managers found that 86 percent track key performance indicators, and those shops were three times more likely to exceed $1 million in annual revenue than shops that do not. This gap stems from decision quality. Knowing your net profit margin, parts gross, and labor efficiency rate weekly helps you make better decisions about pricing, scheduling, and investment.
Underperformance rarely announces itself loudly; it hides inside a full schedule and steady stream of cars.
How Can You Tell When Your Auto Repair Shop Is Underperforming?
Underperformance rarely looks like failure. A full parking lot, busy service desk, and technicians moving between bays create an illusion of productivity. The numbers tell a very different story.
"A shop can look busy and still be losing money — surface-level activity is not the same as operational performance." — Industry Insight
Tip: Don't mistake visible busyness for actual efficiency. The real indicators of shop health live in your metrics, not your parking lot.
Warning: Ignoring key performance indicators (KPIs) — like technician productivity rate, average repair order value, and comeback rate — means you could be consistently underperforming without ever realizing it.
- Surface Signal: Full parking lot
What It Looks Like: High demand
What It May Hide: Slow cycle times, poor throughput
- Surface Signal: Busy service desk
What It Looks Like: Strong customer flow
What It May Hide: Low closing rate on recommended repairs
- Surface Signal: Technicians in bays
What It Looks Like: Active workforce
What It May Hide: Idle time, inefficient workflow
Takeaway: Underperformance is often invisible at first glance. The only way to spot it early is to track the numbers that actually matter.
Thin or Missing Net Profit Shows the Real Loss
The 2026 Ratchet+Wrench Industry Survey of more than 430 independent shop owners and managers found that 7 percent of shops generate no net profit at all, and another 6 percent make between 1 and 4 percent. This means roughly one in eight shops break even after expenses. Net profit margin shows what the business keeps after costs. When it's thin or absent, unexpected costs—a parts price increase or a technician calling in sick—become financial emergencies instead of manageable inconveniences.
Why do low closing rates leave revenue inside the shop?
The same 2026 Ratchet+Wrench survey found that most shops convert 50-59 percent of recommended work, while only 9 percent report closing ratios above 90 percent. The inspection is complete. The technician has identified the problem. The vehicle sits on the lift. Every declined recommendation represents revenue the shop earned the right to capture but forfeited, without needing an additional car or dollar of marketing spend.
When closing rates stay low week after week, higher car counts become a treadmill rather than a growth strategy.
How do key metrics for auto repair shop performance expose closing rate gaps?
Most shops track this through memory and end-of-month gut checks until the pattern repeats unnoticed for months. When a booking, job card, and invoice live as separate records in different places, closing-rate data either disappears or requires manual reconstruction. Shop management software like Support Lane connects those records into a single workflow, making the gap between recommended work and approved work visible in real time.
Weak Technician Efficiency Burns Hours Without Payback
Technician efficiency is where underperformance hides best: hours are spent, and wages are paid, but billable output doesn't match. Hours lost to waiting on parts approvals, unclear job instructions, or disorganized scheduling disappear quietly into the week without showing up as an obvious line item. The 2026 Ratchet+Wrench Industry Survey shows that a significant share of shops report technician efficiency below 80 percent, meaning fewer than eight of every ten hours worked generate billable revenue. Across a team of four technicians over fifty weeks, that gap represents substantial lost labor revenue.
When Warning Signs Stack, the Pressure Compounds
The failure point is usually not one weak metric, but three running simultaneously and disconnected. Low net profit leaves no buffer when parts costs rise. Low closing rates mean the shop identifies work it never converts, so acquisition costs climb while revenue remains uncaptured. Inefficient technician hours extend job times, increasing comebacks and straining the schedule. Each gap feeds the others, and the owner responds by working longer hours instead of fixing the underlying measurement problem. The shop stays open, the calendar stays full, and financial pressure quietly intensifies.
Knowing your numbers is only half the equation; the half most shop owners think they have covered often surprises them most.
Related Reading
Automotive Technician Shortage
Auto Body Shop Marketing
How Often Should You Review Your Auto Repair Shop Performance Metrics?
Weekly review beats monthly review — full stop. Small problems on Tuesday compound quietly until month-end, when lost hours, uncollected revenue, and soft closing rates have already done the damage. The shop feels busy, but the numbers tell a different story.
"Problems that start small on a Tuesday compound quietly until month-end — when lost hours, uncollected revenue, and soft closing rates have already done their damage."
Daily
Risk Level: Lowest
Damage Control: Immediate course correction
Weekly
Risk Level: Low
Damage Control: Catches issues early before compounding
Monthly
Risk Level: High
Damage Control: Too late — revenue already lost
Quarterly
Risk Level: Critical
Damage Control: Severe financial blind spots
Tip: Set a non-negotiable weekly metrics review — even 30 minutes every Monday morning can prevent thousands in compounding losses by month-end.
Warning: A shop that feels busy is not the same as a shop that is profitable. Busyness without data is one of the most common traps auto repair owners fall into—don't let the noise on the floor drown out what your numbers are telling you.
When monthly reviews arrive too late
The failure point is timing, not intention. A technician who loses one billable hour per day to parts delays or slow approvals loses roughly 20 hours by month-end—a gap that never shows up as a recoverable opportunity on monthly reports, only as reduced gross profit with no clear cause. In the 2024 Ratchet+Wrench Industry Survey, 27 percent of shops reported technician efficiency below 80 percent, and 18 percent do not track efficiency at all. When these numbers remain low for weeks before review, shops pay full wages while billing fewer hours, thinning profit on the same volume of work. By the time monthly reviews arrive, lost hours have already reduced the bottom line.
Why does weekly review cadence protect key metrics for auto repair shop performance?
Looking at your labor efficiency rate, effective labor rate, and parts gross margin weekly creates a feedback loop tight enough to act on. If your technician productivity drops from 90 percent to 75 percent in week two, you can identify whether the cause is a scheduling bottleneck, a slow approval process, or a parts supplier issue before it recurs in week three. Monthly reviews collapse that feedback loop: by the time you see the dip, you have already paid four weeks of wages for three weeks of productive output.
What happens when operational metrics stay invisible during the weeks they matter most?
Most shops handle this with end-of-day mental notes and a monthly accounting review, leaving operational metrics invisible when they matter most. When your booking, job record, and invoice live across two tools and a spreadsheet, pulling a mid-week labor-efficiency snapshot takes 30 minutes you don't have. Shop management software like Support Lane consolidates those records into a single workflow, so the numbers you need for weekly reviews are already there.
The one metric that punishes slow tracking most
Comeback rate is the clearest example of a metric that looks fine monthly and signals disaster weekly. A healthy comeback rate sits below 2 percent when tracked monthly. But comeback damage extends beyond finances: a customer who returns with the same problem within two weeks tells three people. If your comeback rate climbs from 1.5 percent to 3.5 percent in a single month and you only see it at month-end, you've already absorbed labor costs, schedule disruption, and reputation exposure before you can trace the pattern to its source.
Why do rising costs make frequent metric reviews essential?
Labor and parts costs keep rising, quietly eroding profit when rates are outdated. Bureau of Labor Statistics data shows motor vehicle maintenance and repair prices rose 5.8 percent in the 12 months ending September 2026. Shops that review effective labor rates only at month-end miss the chance to adjust posted rates or cut discounts while increases remain small. Over successive months, the gap widens, and shops end up doing more work for less real profit.
Which key metrics for auto repair shop performance need weekly versus monthly review?
Not every metric needs the same review schedule. Technician efficiency, effective labor rate, and closing rate on recommended work deserve weekly attention because they change rapidly and respond quickly to operational changes. Review customer satisfaction scores and comeback rates monthly, with a target threshold that triggers an immediate review if crossed mid-month. Net profit margin and parts gross profit are monthly metrics, but only if the weekly inputs feeding them are already clean.
The harder question is what to do with the numbers once you have them.
Related Reading
Auto Repair Shop Workflow Automation
Auto Repair Lead Generation
12 Key Metrics for Auto Repair Shop Performance in 2026
Running a successful auto repair shop means tracking the right performance metrics. They show how much money your shop makes, help you spot operational problems, and guide decisions on pricing, staffing, scheduling, and customer service.
"The shops that thrive don't just fix cars — they track the numbers that drive every smart business decision." — Auto Repair Industry Best Practices
Key Point: Performance metrics are not optional — they are the foundation of every profitable, well-run auto repair shop in 2026.
Tip: Focus on 12 core metrics to get a complete picture of your shop's financial health, operational efficiency, and customer satisfaction — all at once.
- Metric Category: Financial Metrics
What It Reveals: Revenue, profit margins, labor costs
Why It Matters: Shows how much money your shop retains
- Metric Category: Operational Metrics
What It Reveals: Workflow efficiency, bay utilization
Why It Matters: Identifies bottlenecks and waste
- Metric Category: Customer Metrics
What It Reveals: Satisfaction, retention, referrals
Why It Matters: Drives long-term growth and loyalty
- Metric Category: Staffing Metrics
What It Reveals: Technician productivity, scheduling
Why It Matters: Optimizes your team performance
Warning: Shops that ignore key performance indicators risk missing critical problems in pricing, staffing, and scheduling — often until it's too late to course-correct.
1. Average Repair Order
Average Repair Order measures the typical dollar amount a customer spends per service visit. Calculate it by dividing total sales for a period by the number of repair orders completed in that same period. A steady or rising figure indicates the team identifies needed work and presents it clearly so customers approve recommended services. When the number drops, technicians miss inspection opportunities or service advisors fail to explain the value of additional repairs.
2. Car Count
Car Count tracks the total number of unique vehicles entering the shop during a set period (week or month). This metric reveals how much work flows through the bays and whether marketing, referrals, and repeat business keep the schedule full. A consistent or growing count supports steady revenue, while a decline signals lost customers or reduced demand requiring attention to advertising or service quality. Owners use this metric to decide when to add technicians or adjust hours to match capacity with actual demand. Tracking the trend over successive periods prevents sudden volume drops from going unnoticed until cash flow suffers.
3. Effective Labor Rate
Effective Labor Rate shows the actual amount the shop collects per labor hour after discounts, comebacks, and unbilled time. Calculate it by dividing total labor dollars billed by total hours billed on repair orders. The number falls below the posted door rate when advisors apply frequent discounts or when warranty work and free diagnostic time reduce collected revenue. Comparing the two rates reveals profit leaks even when the bays are full. To raise the effective rate, tighten discount policies and document billable hours more clearly.
4. Gross Profit Margin on Labor
Gross Profit Margin on Labor calculates what percentage of labor revenue remains after paying technician wages. Divide labor sales by the cost of technicians who completed the jobs, then subtract the result from one and convert to a percentage. A strong margin indicates the posted rate covers wages with room for overhead and profit. When the margin drops, either the door rate is too low relative to wage costs or technicians take longer than expected to complete jobs. Monitoring this metric separately from parts margin helps owners adjust rates or training before profitability declines.
5. Technician Efficiency
Technician Efficiency compares hours billed on completed jobs to actual hours worked. A higher percentage means technicians finish faster than flat-rate or book time allows, increasing shop capacity without adding staff. Lower numbers indicate missing tools, unclear instructions, or insufficient practice on certain repairs. Owners review individual and shop-wide efficiency to identify training needs and process bottlenecks. Improving efficiency increases output within the same hours while keeping labor costs stable.
6. Technician Productivity
Technician Productivity measures how much of a technician's paid time generates revenue, calculated by dividing billable repair order hours by total clocked-in hours. High productivity indicates jobs are ready when technicians arrive, and parts and approvals move quickly. Low numbers reveal scheduling bottlenecks, incomplete estimates, or delays that leave skilled workers idle. Tracking this metric by person and day identifies workflow improvements that free up productive hours without additional hiring.
7. Bay Utilization
Bay Utilization shows the percentage of available bay time that vehicles occupy during shop hours. Calculate it by dividing total hours bays hold cars by total hours those bays remain open. High utilization indicates efficient scheduling and smooth vehicle flow; low utilization signals insufficient incoming work or internal delays between jobs. Owners use this metric to decide whether to increase marketing efforts or improve handoffs between advisors and technicians.
8. Estimate Approval Rate
Estimate Approval Rate tracks the percentage of recommended work that customers approve, calculated by dividing approved recommendation dollars by total recommendation dollars. A higher rate indicates advisors present findings clearly and customers trust the shop enough to proceed with repairs. A lower rate leaves identified work incomplete and revenue uncollected, even when the vehicle occupies the bay. Reviewing the rate by advisor and job type reveals where communication or inspection practices need improvement.
9. Comeback Rate
Comeback Rate measures the percentage of vehicles that return within a short period for the same or a related problem after the original repair. Calculate it by dividing comeback visits by the total number of repair orders in the same timeframe. A low rate indicates solid workmanship and clear communication. A rising rate signals quality issues, incomplete inspections, or rushed jobs that force the shop to redo work at no charge. Tracking comebacks by technician and repair type helps owners address training gaps or process flaws before repeated free labor erodes profit and customer confidence.
10. Customer Retention Rate
Customer Retention Rate shows what percentage of past customers return for more service within a set time period, such as a year. Calculate it by comparing returning customers against total customers served in the previous period. Strong retention indicates reliable service and relationships that bring customers back without heavy marketing spend. A declining rate suggests customers leave for competitors after one or two visits, often because communication is unclear or problems go unresolved. This metric shows whether your follow-up practices and service quality sustain your customer base or force you to constantly replace lost business.
11. Net Profit Margin
Net Profit Margin shows what percentage of total revenue remains after paying all expenses: technician wages, parts costs, rent, utilities, insurance, and taxes. To calculate it, subtract all operating costs from total sales, then divide by total sales. A healthy margin means the shop can cover all costs and the owner has money left over to take home or reinvest in the business. When the margin shrinks, overhead has typically grown faster than revenue, or discounts and free work have reduced bottom-line dollars. Checking this number monthly reveals whether your pricing, staffing, and spending choices are improving the shop's financial health.
12. Parts Gross Profit Margin
Parts Gross Profit Margin measures what percentage of parts revenue remains after paying wholesale costs. A strong margin indicates consistent markups and shows you're not discounting parts to close deals. Weak margins occur when suppliers raise prices without corresponding price increases, or when advisors discount heavily. Tracking margin by supplier and job type helps owners negotiate better pricing and refine the parts matrix so parts sales contribute reliably to overall profit.
Why do these key metrics matter for an auto repair shop's overall performance?
These twelve metrics provide clear visibility into volume, pricing, efficiency, quality, and financial results, helping owners spot problems early and maintain profitability.
How to Improve Auto Repair Shop Performance Using KPI Data
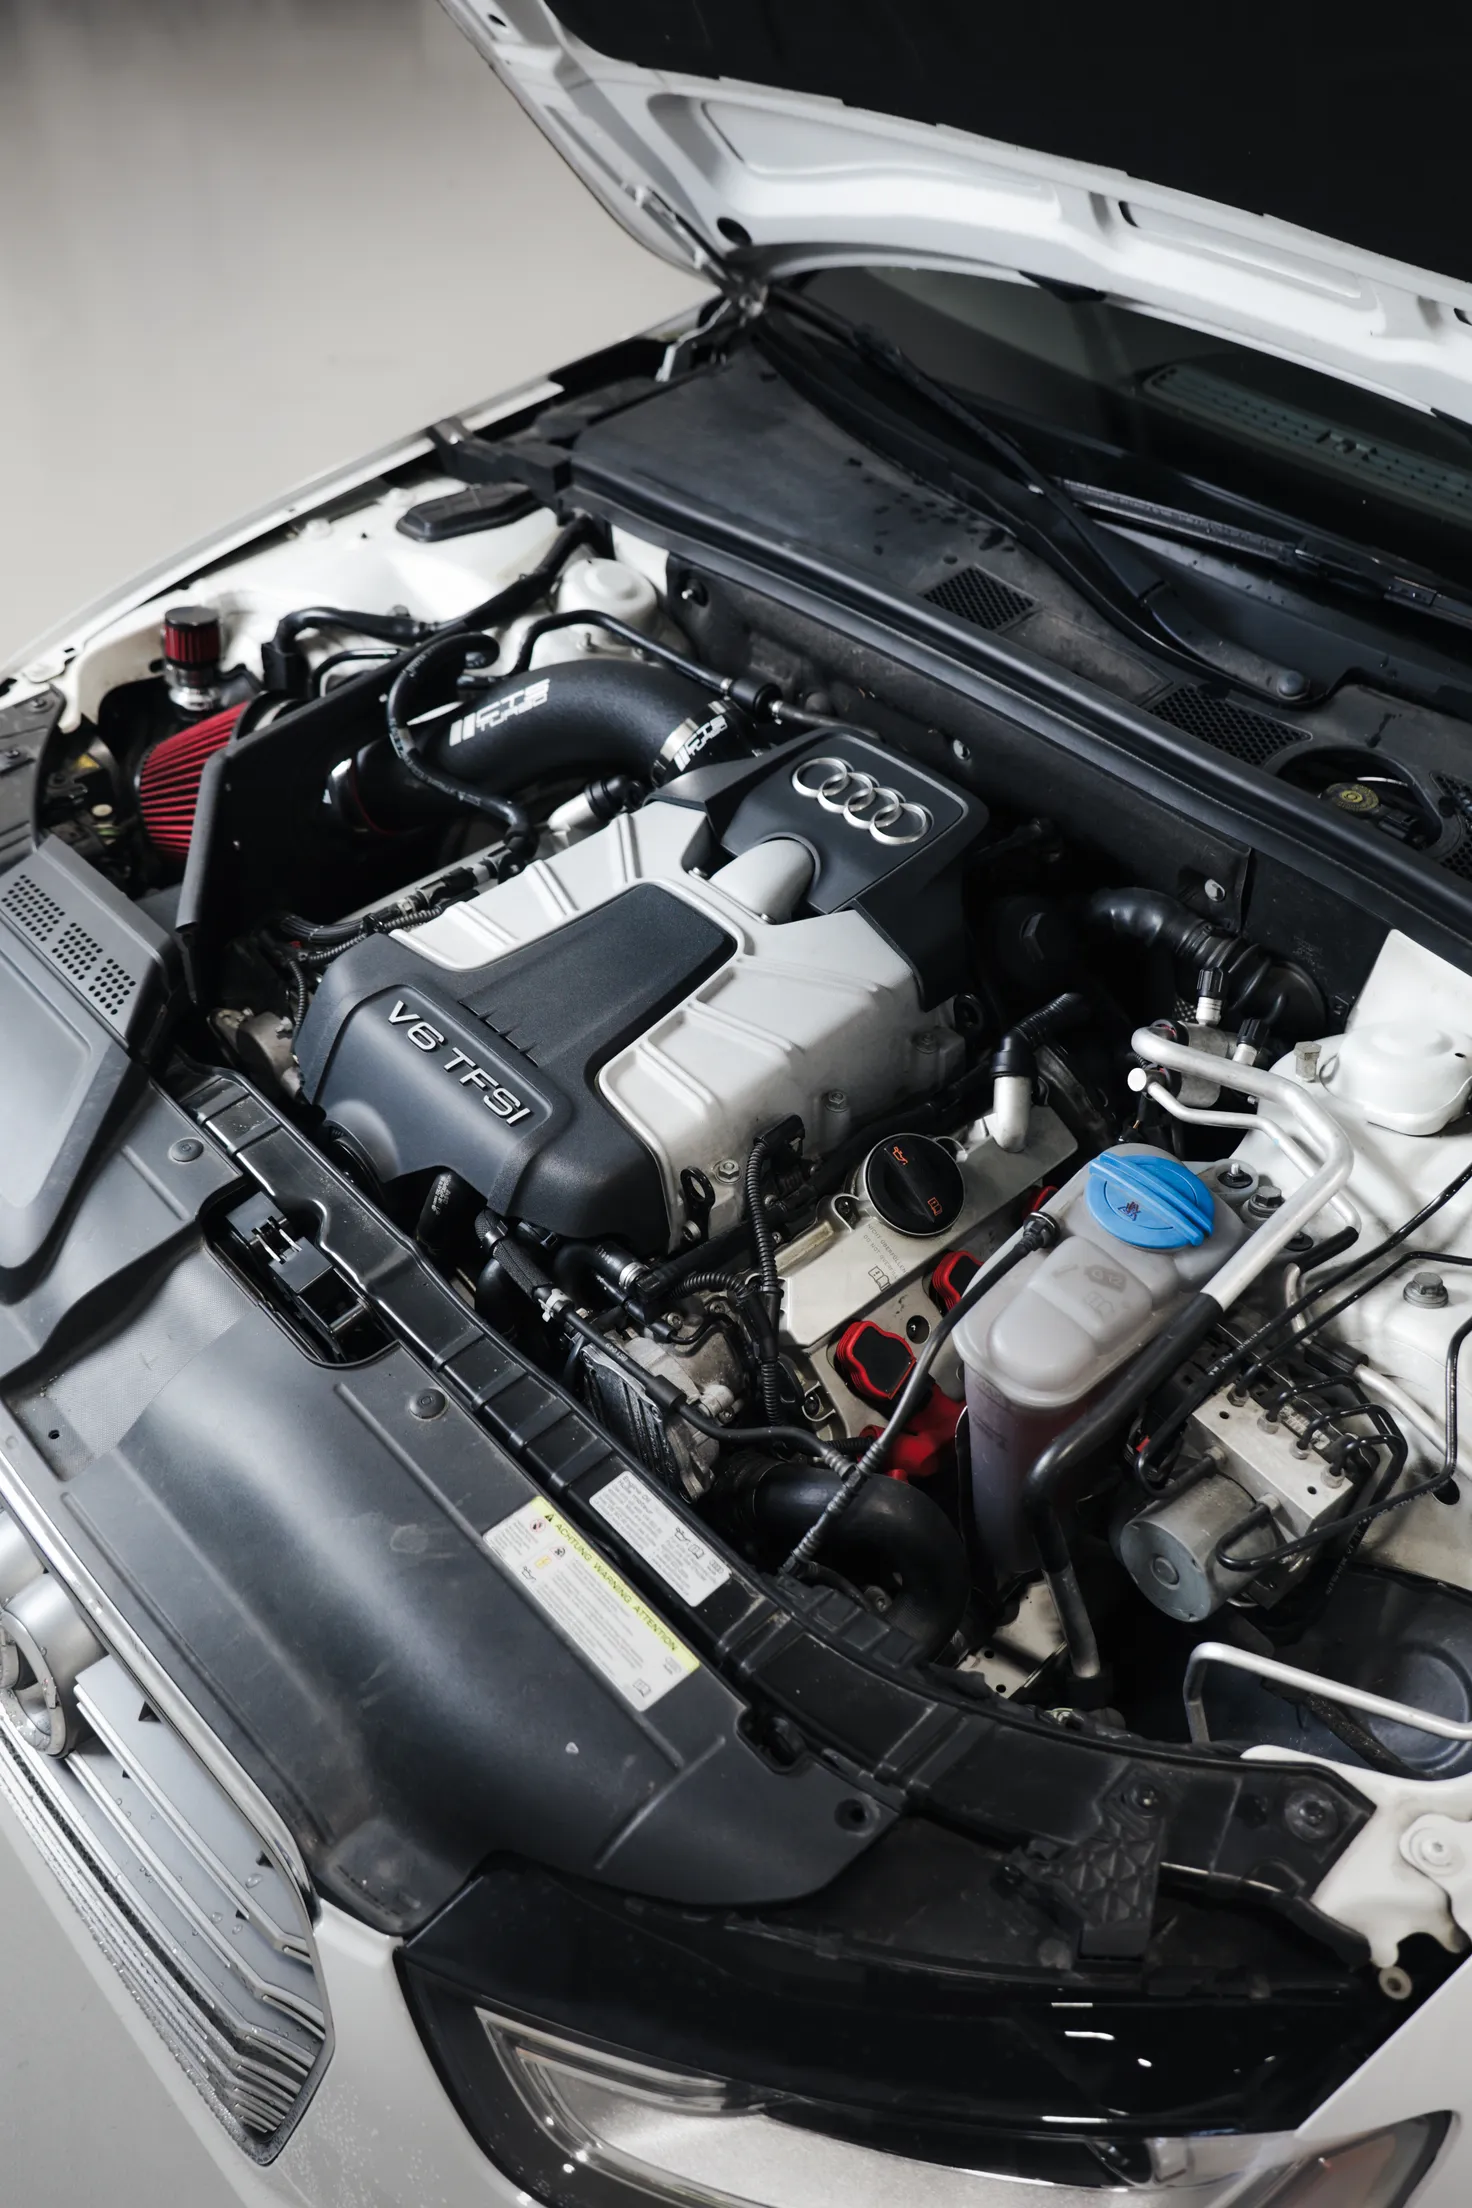
Improving auto repair shop performance starts with tracking key performance indicators (KPIs). By actively using this data, you can find hidden problems, make smart decisions, and build a more efficient, profitable shop.
"Shops that track KPIs consistently are positioned to identify inefficiencies before they become costly problems — turning raw data into a competitive advantage." — Industry Best Practice
Key Point: KPI tracking is not a luxury — it's the foundation of every high-performing auto repair shop. Without it, you're making decisions blindly.
Tip: Start by identifying your top 3–5 KPIs — such as technician efficiency rate, average repair order value, and customer return rate — and review them on a weekly basis to spot trends early.
- Technician Efficiency Rate
What It Measures: Labor hours billed vs. hours worked
Why It Matters: Identifies productivity gaps
- Average Repair Order Value
What It Measures: Revenue per customer visit
Why It Matters: Tracks upsell performance
- Customer Return Rate
What It Measures: Repeat customer percentage
Why It Matters: Measures loyalty and satisfaction
- Parts Gross Profit Margin
What It Measures: Profit on parts sold
Why It Matters: Reveals pricing strategy effectiveness
Warning: Collecting KPI data without acting on it is one of the most common mistakes shop owners make. Data is only valuable when it drives real change.
Review Numbers on a Set Schedule
Checking the same figures weekly and monthly turns scattered results into clear patterns. Weekly reviews of average repair order, car count, and technician productivity reveal whether the current schedule and sales process keep the shop on track. Monthly reviews of effective labor rate, gross profit margins, and net profit confirm whether daily choices improve the bottom line. When a number drops for two consecutive periods, the owner can identify problems in inspections, approvals, or scheduling before losses compound. Consistent reviews keep the team focused on one or two fixes at a time instead of chasing every issue at once.
Raise Average Repair Order Through Thorough Inspections
The average repair order increases when technicians conduct thorough vehicle inspections, and advisors clearly explain findings. Photos of worn parts and detailed notes about why repairs are needed help customers understand their importance. Advisors who explain the risks of delaying repairs and the benefits of addressing them now secure more approvals for recommended work. Tracking approved work against total recommendations reveals which advisors close more discovered repairs. Improving the inspection process and explanations increases revenue per visit without requiring additional customer traffic.
Cut Idle Time to Lift Productivity and Efficiency
Technician productivity rises when parts arrive before the job starts and approvals happen quickly, and falls when technicians wait for parts, customer decisions, or the next vehicle. Efficiency suffers when jobs run long because of missing tools or unclear instructions. Owners can distinguish waiting problems from skill problems by comparing hours billed against hours available and actual time worked. Improving the handoff between advisor and technician—ensuring the vehicle is ready and parts are staged—lets the same crew complete more billable hours each day.
Track Approval Rates to Tighten Sales Conversations
The percentage of recommended work that customers approve measures how well the shop communicates findings. Low approval rates signal that advisors either miss key details during inspection or fail to connect recommendations to the customer's driving needs. Tracking approvals by advisor and job type reveals where conversations break down. Advisors who walk through photos and explain consequences of unrepaired issues close a higher share of identified work. Raising approval rates converts completed inspections into additional revenue on the same vehicles.
Use Shop Management Software to Keep Jobs Moving
Shop management software provides live visibility into every job, revealing bottlenecks before they impact productivity. Support Lane, for example, displays jobs on a kanban board with customizable stages that teams drag and drop as work progresses, tracking time spent in each stage. The system handles appointments with calendar booking and sends 24-hour reminders, while auto-generated work order numbers and full job details keep teams aligned without paperwork. By making vehicle status clear at a glance, Support Lane reduces wait times and improves productivity and labor efficiency.
Protect Margins by Watching Comebacks and Retention
Comeback rate and customer retention rate show whether quality and follow-through protect profit after the initial sale. A rising comeback rate means unpaid work to fix the same issue twice, lowering the effective labor rate on the original job. Customer retention rate shows how many past customers return within a year; a drop signals that communication or unresolved concerns push people to competitors. Tracking both metrics by technician and advisor identifies specific processes needing tighter checks or clearer follow-up. Reducing comebacks and increasing returning customer share keeps more earned revenue in the shop instead of replacing lost business.
How Support Lane Helps You Track and Improve Auto Repair Shop Performance
Tracking numbers without a system to act on them is like reading a map after you've already missed the turn. The real problem isn't knowing which numbers matter — it's the wait between when a problem shows up in the data and when someone can actually do something about it. That wait gets much shorter when the booking, the job card, and the invoice are all in the same place.
Tip: The moment your booking, job card, and invoice live under one roof, your team stops chasing data and starts acting on it — faster than ever before.
"The gap between seeing a problem in your data and fixing it is where auto repair shop revenue quietly disappears." — Support Lane
Key Point: Unified shop management isn't just a convenience — it's the critical difference between reactive firefighting and proactive performance improvement.
- Disconnected System
Delayed problem detection
Data spread across multiple tools
Long wait before action is taken
Missed revenue opportunities
- Support Lane Unified System
Real-time visibility into issues
Booking, job card & invoice in one place
Immediate response to performance gaps
Captured and tracked automatically
Why do disconnected tools make key auto repair shop performance metrics harder to act on?
A shop owner checks the appointment calendar in one tab, opens a separate spreadsheet to estimate labor hours, and pulls invoices from a third tool to calculate parts margins. By the time those three data sources are synthesized into actionable insight, the week is over, and the decisions that could have changed the outcome are no longer available. The numbers describe what happened, not what is happening.
How does a unified record reduce the hidden costs showing up in your shop data?
Most shops track jobs on a whiteboard or printed dispatch sheet because it's familiar and requires no setup. Hidden costs show up as technician downtime, approval delays, and parts markups that vary by job. Support Lane addresses that friction by keeping job notes, estimates, customer messages, and invoices attached to a single record, so the advisor sending an approval request and the owner reviewing parts margin that afternoon both view the same data without manual assembly.
Where the numbers actually come from
According to Gitnux Auto Repair Industry Statistics, independent auto repair shops make profits of 6 to 12 percent. A few percentage points of improvement in worker efficiency or parts profit margins can mean the difference between profitability and breaking even in a quarter. Support Lane's kanban pipeline tracks how long each job stays in every stage, helping shop owners spot wasted hours before they become monthly losses.
Labor accounts for roughly 50 percent of every repair bill, making an effective labor rate one of the shop's most important numbers. When labor hours and parts markups appear as separate line items on the same job record, the owner sees the true dollars collected against billed hours without waiting for month-end reconciliation. That visibility transforms a lagging financial report into a live operational signal.
What consistency actually unlocks
Shops that improve over time share one thing: they compare the same inputs week to week. When each advisor prices the same service differently, repair order averages fluctuate for reasons unrelated to volume or efficiency. Standardized service templates eliminate that confusion, so when numbers change, the owner knows the change is real. That's when metrics become a decision-making tool rather than a reporting exercise.
The hardest part isn't building the tracking habit. It's what you do the first time the numbers tell you something you can't ignore.
Sign up for Your Free Trial to Manage Your Auto Shop with Ease Today
Most shop owners track metrics inconsistently because their records scatter across three different places: a booking in one app, a job on a whiteboard, an invoice in a spreadsheet. By the time you pull it all together, the moment to act has passed.
"When your data lives in three different places, you're not running your shop on insights — you're running it on guesswork." — Support Lane
Tip: If you can't see your job status, scheduling, and invoices in one place, your metrics are already working against you.
Support Lane brings job tracking, scheduling, estimates, invoices, and customer records into one connected workflow — grounding your metrics in clean, consistent data. No more hunting across apps, whiteboards, or spreadsheets to answer a simple question about your shop's performance.
- Scattered Workflow
Bookings in a separate app
Jobs tracked on a whiteboard
Invoices buried in spreadsheets
Customer records stored separately
Metrics pulled manually
- Support Lane Workflow
All bookings in one dashboard
Live job tracking in real time
Invoices linked directly to jobs
Customer history connected to every job
Performance data always ready
Best Practice: Visit Support Lane to explore the platform and turn performance numbers into decisions you can trust — starting today.
Key Point: The difference between a shop that reacts and a shop that grows is clean, connected data — and Support Lane delivers exactly that.
Related Reading
Auto Repair Promotion Ideas
Best Diagnosis Machine For All Cars
Appointment Booking Software For Auto Repair
Mechanic Work Order App
Seo For Auto Repair Shops
Invoice Software For Mechanic Shop
Spare Parts Inventory Management Best Practices
Mechanic Book Hours
Automotive Customer Loyalty Programs
Ready to modernize your shop?
Join the independent auto repair shops already using Support Lane to manage their jobs, customers, and invoices in one place.